The Clawboo dashboard is a single-page app with a stable three-column shell and one large content area that swaps between views. This page is a map: it walks the shell left-to-right (team sidebar, agent-list column, content area), explains the view modes that decide what fills the content area, and clarifies the one distinction newcomers trip on most: Atlas (the global, all-teams Ghost Graph) versus the per-team Ghost Graph you see inside a team’s group chat.
Read this after you’ve finished onboarding (native or OpenClaw) and have at least one team. If the dashboard is empty, deploy your first team first.
The shell
The app is three persistent columns plus a swappable content area:
The team sidebar (column 1) and the content area (column 3) are always present. The agent-list column (column 2) is hidden in two cases: when you’re in the standalone Boo Zero view, and when you collapse it with the sidebar’s collapse toggle. The Boo Zero view dedicates the whole window to Boo Zero’s agent detail, so the agent list, which is team-scoped, has nothing to show.
Widths are fixed: the team sidebar is 60px, the agent-list column is 208px. The content area takes the rest. There’s no draggable shell divider; the only resizable seams are inside views (the agent detail panels, the group-chat graph/chat split).
- The Boo Zero mascot (the Clawboo logo). Clicking it deselects any team and opens the standalone Boo Zero view. Boo Zero is the universal team leader, teamless in the registry, but present in every team. Right-clicking the mascot offers “Show all agents,” which clears the team filter and opens Atlas.
- One icon per active team (its emoji on its color). Clicking a team icon selects that team and opens its group chat directly, not Atlas. A Discord-style pill marks the selected team. Right-clicking a team icon opens a context menu: archive/unarchive, “Refresh Protocol” (regenerate each agent’s routing file), “Delete team only” (orphan the agents), or “Delete with agents.”
- The ”+” button opens the create-team modal.
- The collapse toggle hides or shows the agent-list column.
Archived teams are filtered out of the rail; unarchive one from a team’s context menu while it’s still visible, or before archiving.
Agent-list column (column 2)
This column is team-scoped: it shows the agents of the selected team (or all agents when no team is selected), filtered live by the search box. Top to bottom:
- The team header: the selected team’s name (or “All Agents”) plus the visible agent count.
- The search box: filters the agent list by name as you type.
- The Group Chat row: when a team is selected and has agents, a single row at the top of the list shows the team “photo” (a stack of up to four overlapping Boo avatars, leader first, with a “+N” badge for larger teams) and an aggregate team-status badge. Clicking it opens the team’s group chat. It’s styled to read as a peer of the agent rows beneath it, not a section header.
- The agent rows: each Boo with its avatar, name, a live status badge (Idle / Working / Error / Sleeping, with a fine-grained activity verb when running), and a “seen X ago” timestamp. Clicking a row opens that agent’s detail view. A trash icon appears on hover to delete the agent.
- Create Boo: adds a new agent to the selected team (shown only when connected to a runtime that can create agents).
- The global nav: anchored to the bottom of the column, split into a primary block and a secondary block.
The global nav is where you reach every dashboard view that isn’t an agent or a team chat:
| Block | Item | View it opens |
|---|
| Primary | Atlas (All Teams) | The global Ghost Graph |
| Primary | Fleet (Overview) | Fleet-health summary |
| Primary | Marketplace | Browse 304 agents and 82 teams |
| Secondary | Board | The durable kanban board |
| Secondary | Runtimes | Connect/manage runtimes |
| Secondary | Memory | Shared-memory browser |
| Secondary | Governance | Budgets, caps, audit, approvals |
| Secondary | Capabilities | The capability inventory |
| Secondary | Approvals | Pending tool/exec approvals (with a count badge) |
| Secondary | Scheduler | Routines (scheduled team work) |
| Secondary | Tokens Used | Cost dashboard |
| Secondary | System | Gateway control, model, API keys |
| Secondary | Observability | Traces, errors, fleet health, evals |
| Secondary | System Health | Boot probe + degradation checks |
Content area (column 3)
The content area renders exactly one view at a time, chosen by the current view mode (see below). When you switch views, the old view fades out and the new one fades in. Pressing Escape from an agent, Boo Zero, or group-chat view returns you to the welcome screen.
View modes
The dashboard’s state is a single discriminated union, the ViewMode, and the content area is a switch over it. There are five shapes:
| View mode | What it shows | How you reach it |
|---|
welcome | The welcome screen | Escape from a chat/agent view, or no selection |
agent | An agent’s three-panel detail view | Click an agent row |
booZero | Boo Zero’s detail view (column 2 hidden) | Click the mascot |
groupChat | A team’s group chat (graph + chat split) | Click a team icon or the Group Chat row |
nav | One of the 14 nav panels | Click a nav item |
nav mode carries a view field, one of graph (Atlas), fleet, approvals, cost, marketplace, scheduler, system, obs, board, runtimes, memory, governance, capabilities, health. The dashboard opens on nav: graph (Atlas) by default, so a fresh launch lands you on the org-wide map.
Keyboard navigation
Escape: leave an agent / Boo Zero / group-chat view back to the welcome screen (ignored while a file-editor overlay is open or you’re typing).Cmd/Ctrl + 1…6: jump to a nav view, in this order: 1 Atlas, 2 Marketplace, 3 Approvals, 4 Scheduler, 5 Cost, 6 System.
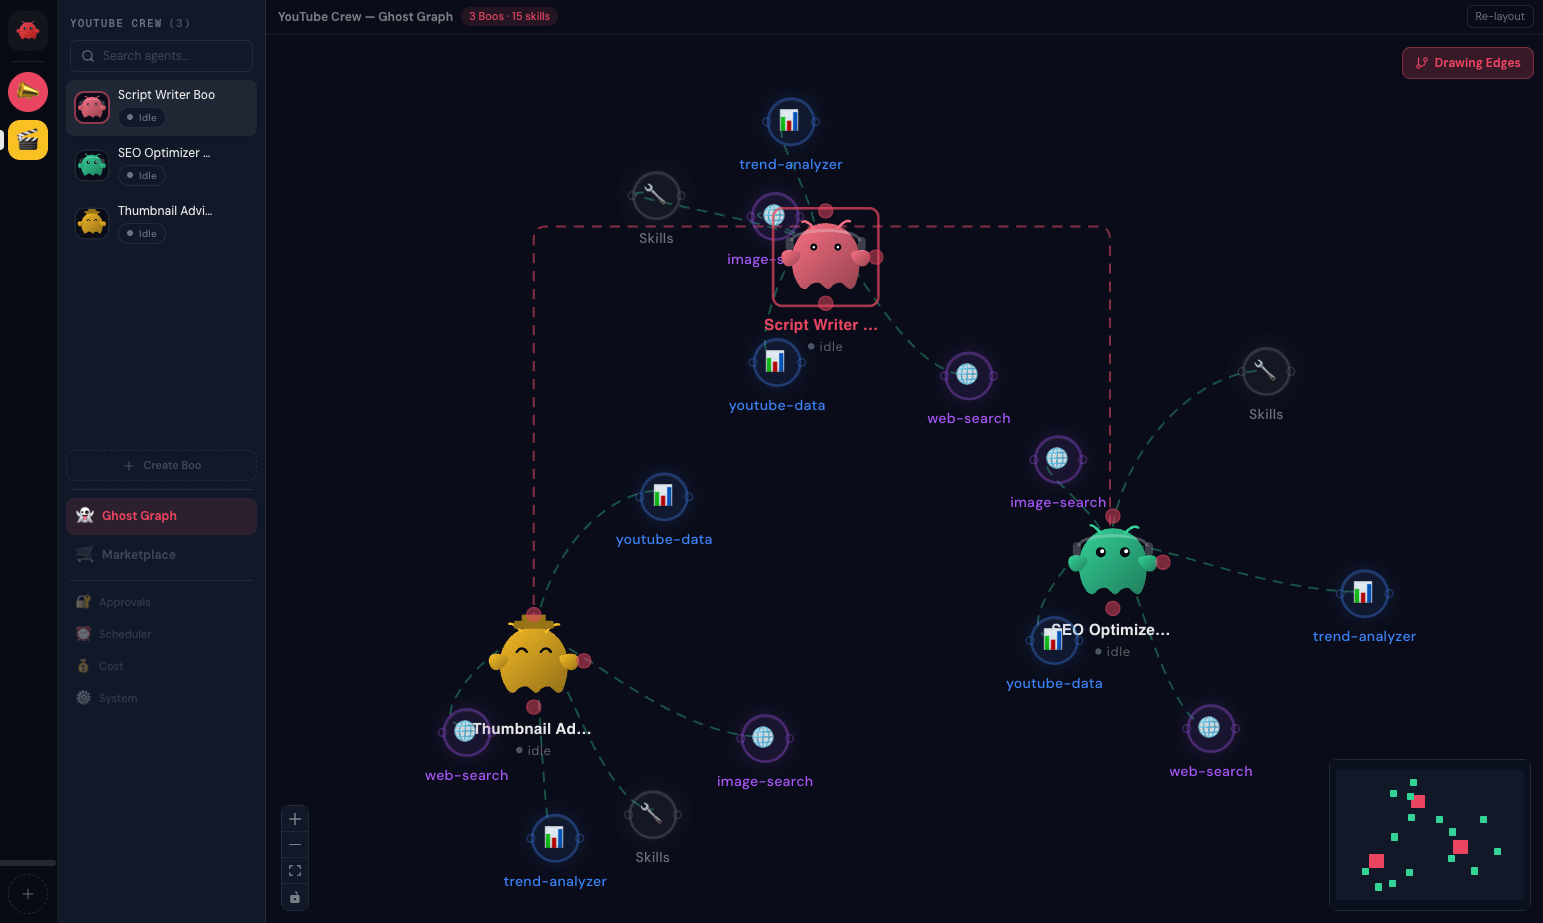
Atlas vs the per-team Ghost Graph
The single most useful thing to internalize: the same Ghost Graph component renders at two scopes, and which one you’re looking at depends on how you got there.
- Atlas is the Ghost Graph at
atlas scope. It ignores the selected team and pulls every agent onto one canvas, with Boo Zero presiding at the top of the hierarchy and each team laid out as a row beneath it. Reach it from the Atlas nav item (column 2) or the mascot’s “Show all agents.” This is the org-wide map, every team at once.
- The per-team Ghost Graph is the same component at the default
team scope, embedded inside a team’s group-chat view. It filters to the selected team’s agents (plus Boo Zero) and renders that team’s internal routing as a top-down org chart. You don’t navigate to it separately; it’s the top half of the group-chat split.
So: Atlas is a nav destination; the per-team Ghost Graph is part of a team’s group chat. They share rendering, hover cascades, team halos, and the peacock skill-expand interaction, but Atlas is scoped to all teams while the embedded graph is scoped to one. The nav slot kept the internal id graph for historical reasons, which is why the keyboard shortcut and the nav item both point at Atlas.
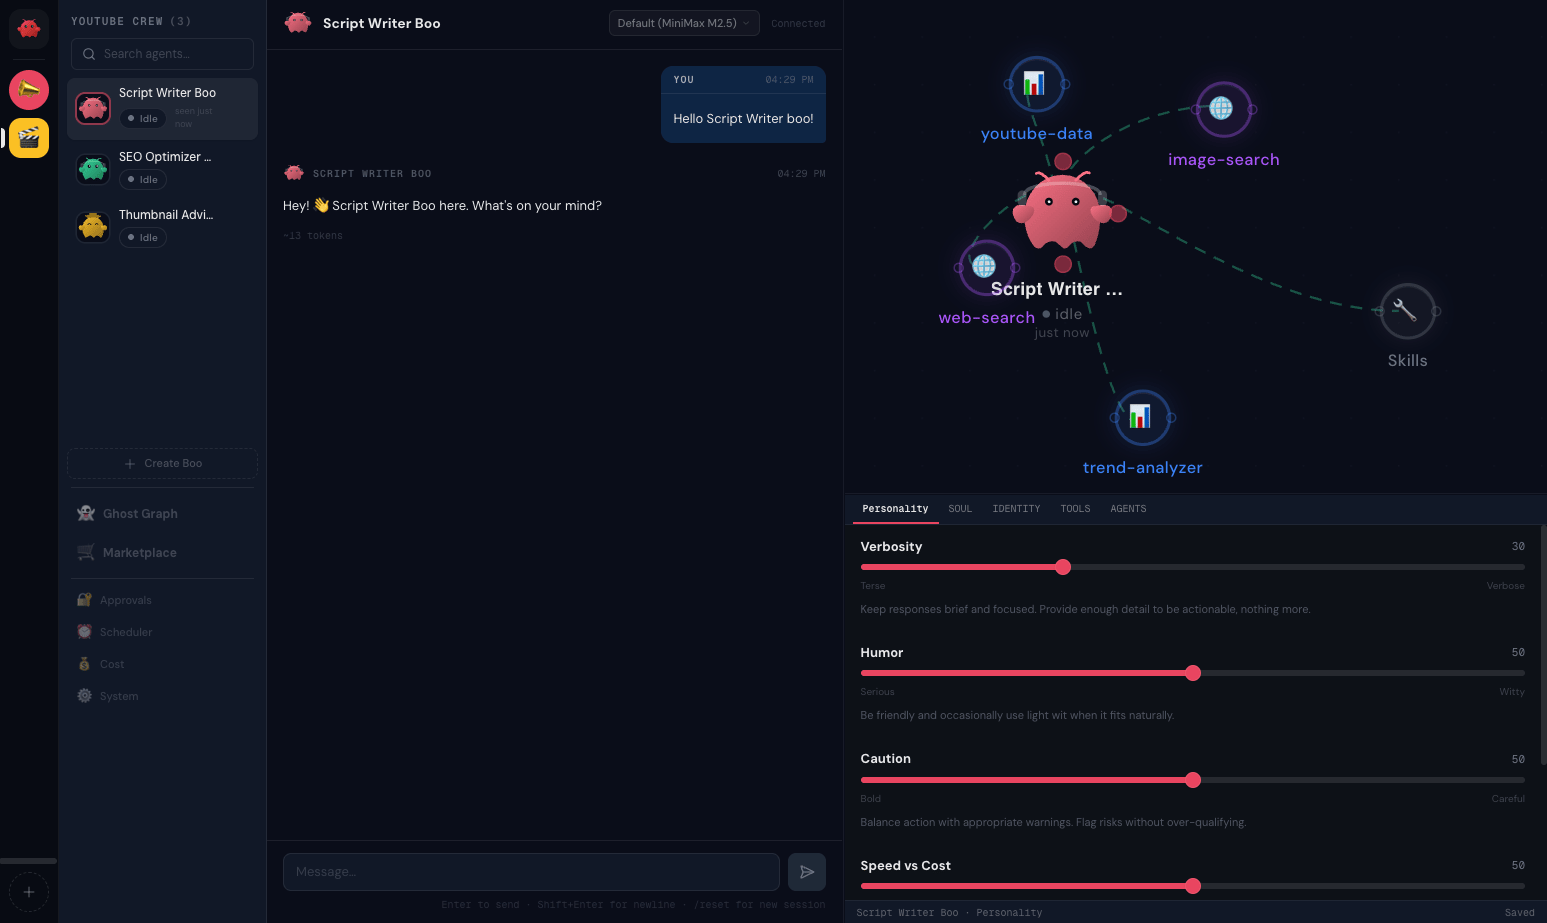
The agent detail view
Clicking an agent opens a three-panel detail view: a chat panel on the left, a single-agent compact graph (its Boo, skills, and resources) top-right, and an inline editor bottom-right with tabs for personality sliders and the four agent files (SOUL.md, IDENTITY.md, TOOLS.md, AGENTS.md). The panels are resizable, and their sizes persist across sessions.
Where to go from here
- Click a team icon to open its group chat and watch the team collaborate.
- Open Atlas to see how all your teams relate under Boo Zero.
- Open the Board to see delegated work as durable, claimable tasks.
- Open Runtimes to connect Claude Code, Codex, Hermes, or OpenClaw alongside the native runtime.
See also
- Deploy your first team, get a team on screen, then come back to this map
- Teams and planes, what a team is, shared vs private plane
- The board, the durable substrate beneath the Board view
- Peer chat, what happens inside a team’s group chat
- Agent model, Boo, Boo Zero, and the runtime classes
- Connecting runtimes, what the Runtimes view manages
- Glossary, canonical term definitions