> ## Documentation Index
> Fetch the complete documentation index at: https://docs.claw.boo/llms.txt
> Use this file to discover all available pages before exploring further.
# Using the Observability dashboard
> Read traces, error taxonomy, fleet health, the delegation graph, and run the smoke evals from the Observability panel.
Use this page when you want to see what your agents actually did: the cost and token spend of a multi-agent task, why an agent stopped, which agents are stalled, and how the smoke evals score the harness. Everything here reads from the durable orchestration **event log**, an append-only stream that the panel folds into projections. Replaying the same log always reproduces the same view, so the dashboard cannot drift from reality.
The whole surface is the **Observability** panel (`ObsPanel`), backed by the `/api/obs/*` routes. Observability is always on; there is no feature gate to enable, and the handlers serve unconditionally.
## Prerequisites
There is nothing to configure. The Observability panel is always available. The data is empty until agents run board tasks; run a [team](/using/teams) or a [board](/using/board) task first, then come back.
* A team that has executed at least one board task (delegation, tool calls, cost). A fresh install with no runs shows empty states everywhere.
* Nothing to install; the panel ships in the Clawboo server.
## Where it lives
Open **Settings** (the gear at the bottom of the sidebar, or `Cmd/Ctrl + ,`), then **Observability** under the Insights group (the `Activity` icon). The `Cmd`/`Ctrl`+1–4 quick-nav slots cover the sidebar work surfaces (Atlas, Fleet, Marketplace, Board); Observability, like the other Settings panels, is reached through the Settings modal instead.
The panel is two columns:
* **Left column** (fixed width): three stacked sections: **Fleet health**, **Error taxonomy**, and the **Traces** list.
* **Right column**: the **Eval scorecard** at the top, then the selected **Trace** with its metrics bar and span-nested timeline, then the **Delegation graph**.
A **Refresh** button in the header re-fetches everything; the panel also auto-refreshes every 5 seconds.
```mermaid theme={"theme":{"light":"github-dark","dark":"github-dark"}}
flowchart LR
log[("Orchestration event log
(SQLite, append-only)")]
log -->|"GET /api/obs/health"| fh[Fleet health]
log -->|"GET /api/obs/errors"| tax[Error taxonomy]
log -->|"GET /api/obs/events"| traces[Traces list]
traces -->|"click a trace"| td["GET /api/obs/traces/:traceId"]
td --> timeline[Span-nested timeline + metrics]
log -->|"GET /api/obs/graph"| dg[Delegation graph]
evals["POST /api/eval/smoke"] --> sc[Eval scorecard]
```
## Steps
### 1. Read the traces list and open one
A **trace** groups every event that shares a `traceId`, the full multi-agent task, from the leader through its specialists down to individual tool calls. The panel derives the **Traces** list from the recent event feed (`GET /api/obs/events?order=desc&limit=300`), showing the newest traces first with an event count and timestamp, capped at 40 entries.
Click a trace to open it. The panel fetches `GET /api/obs/traces/:traceId` (all events for that id, ordered causally by `seq`), and renders two things in the right column:
* **A metrics bar** computed from the trace's events:
* **cost**: total USD for the run
* **tokens**: input → output token counts
* **tok/min**: output tokens per minute over the observed window
* **tools**: total tool calls
* **tool err**: failed tool results / total tool results, shown as a percentage (amber when above 0%)
* **A span-nested timeline**: each event indented by its span depth, following the `span_start` → `parentSpanId` chain. A child task's run nests visually under its parent's. Errors render in the accent color, span markers in mint, cost events in amber.
The metrics are reconciled per run: a runtime that reports cost only at completion (no mid-run `cost` event) still shows the real total, because the metrics take the larger of the summed `cost` events and the final `execution_completed` total. So OpenClaw runs (no incremental cost) and native runs (per-turn cost) both read correctly.
### 2. Triage the fleet
The **Fleet health** section (`GET /api/obs/health`) projects each agent into the fleet-health triage taxonomy. An agent with an **open** execution (started but not completed) is:
| Status | Meaning | Pill tone |
| --------- | --------------------------------------------------------------------------------------------- | --------------- |
| `working` | A recent event landed | working (mint) |
| `stalled` | No event for over 5 minutes while an execution is open | warning (amber) |
| `zombie` | No event for over 30 minutes while an execution is open; the process is almost certainly dead | error (red) |
| `idle` | No open execution | idle |
Each row shows the agent id, an open-run count, the status, and the agent's spend. A `zombie` is what orphan reconciliation will reap on the next server boot.
### 3. Scan the error taxonomy
The **Error taxonomy** section (`GET /api/obs/errors`) groups `error` events by their class and counts them, sorted by frequency. Clawboo classifies every runtime/tool failure into a fixed set of expected classes:
`InvalidArgs` · `ContextOverflow` · `Timeout` · `ProviderError` · `RateLimited` · `UserAborted` · `UnexpectedEnv` · `Unknown`
The classifier matches the error's code and message against ordered rules. `ContextOverflow` catches oversized-input failures, and its rule is checked ahead of the `InvalidArgs` rule so a "context length exceeded" `400` lands there instead of in the generic bad-request bucket; it is an expected recoverable condition, not a harness bug. Anything that matches none is `Unknown`; and `Unknown` is treated as a **harness bug**: it is flagged in the panel (an accent-colored badge plus a "harness bug" label) and counted in the section header (`N bugs`). An unrecognized failure is treated as a defect in Clawboo's own error handling, not a normal runtime hiccup, so it alerts rather than being swallowed.
The error feed is also the agent-readable "what errored in the last window" query; pass `?since=` to scope it, or `?harnessBug=true` to return only the harness bugs.
### 4. Follow the delegation graph
The **Delegation graph** section (`GET /api/obs/graph`) is the event-sourced projection of the task graph: task nodes (with status and cost), `delegation` edges (a parent task spawned a child), and `dependency` edges (a task is blocked on another). The legend distinguishes the two edge kinds: a solid arrow for delegation, a dimmed arrow for dependency. Each row reads `source → target kind`. This is the same projection that drives the live overlay on the [Ghost Graph](/using/ghost-graph).
### 5. Run the smoke evals
The **Eval scorecard** at the top of the right column has a **Run smoke evals** button. Clicking it sends `POST /api/eval/smoke` and renders the real `SuiteReport`.
This runs the deterministic `SMOKE_TASKS` suite, the exact subset CI runs, with **no live model, no API keys, no executor, and no network**. Each trial executes against an ephemeral temp-dir SQLite board, so your real `clawboo.db` is never touched and nothing pollutes the Board / Fleet / Observability views. The body accepts `{ trials?, k? }`, both clamped to `[1, 3]` so the route can never become a load generator; the scorecard calls it with `{ trials: 1 }`.
The report renders:
* **pass\@1**: fraction of tasks where at least one trial succeeded
* **pass^k**: fraction where all `k` trials succeeded
* **k** and **tasks** counts
* A per-task table: task id, suite (`capability` / `regression`), kind (`coding` / `research` / `coordination`), per-task pass\@1, and mean score.
Below the live report is the **Ablation** card. It renders the `±verifier × ±structured-state` scorecard as a **shape, explained, not run**; a `CI only` pill marks it. The four variants (`full`, `−verifier`, `−structured`, `none`) and the two contribution rows (`verifier`, `structured-state`) are listed with em-dash placeholders. The ablation is a harness self-test (the 4 variants toggle the harness's own subsystem flags); it runs only from the manual `evals.yml` workflow, never from this button, and no live-model judge is wired into it yet.
### 6. Watch the live activity terminal
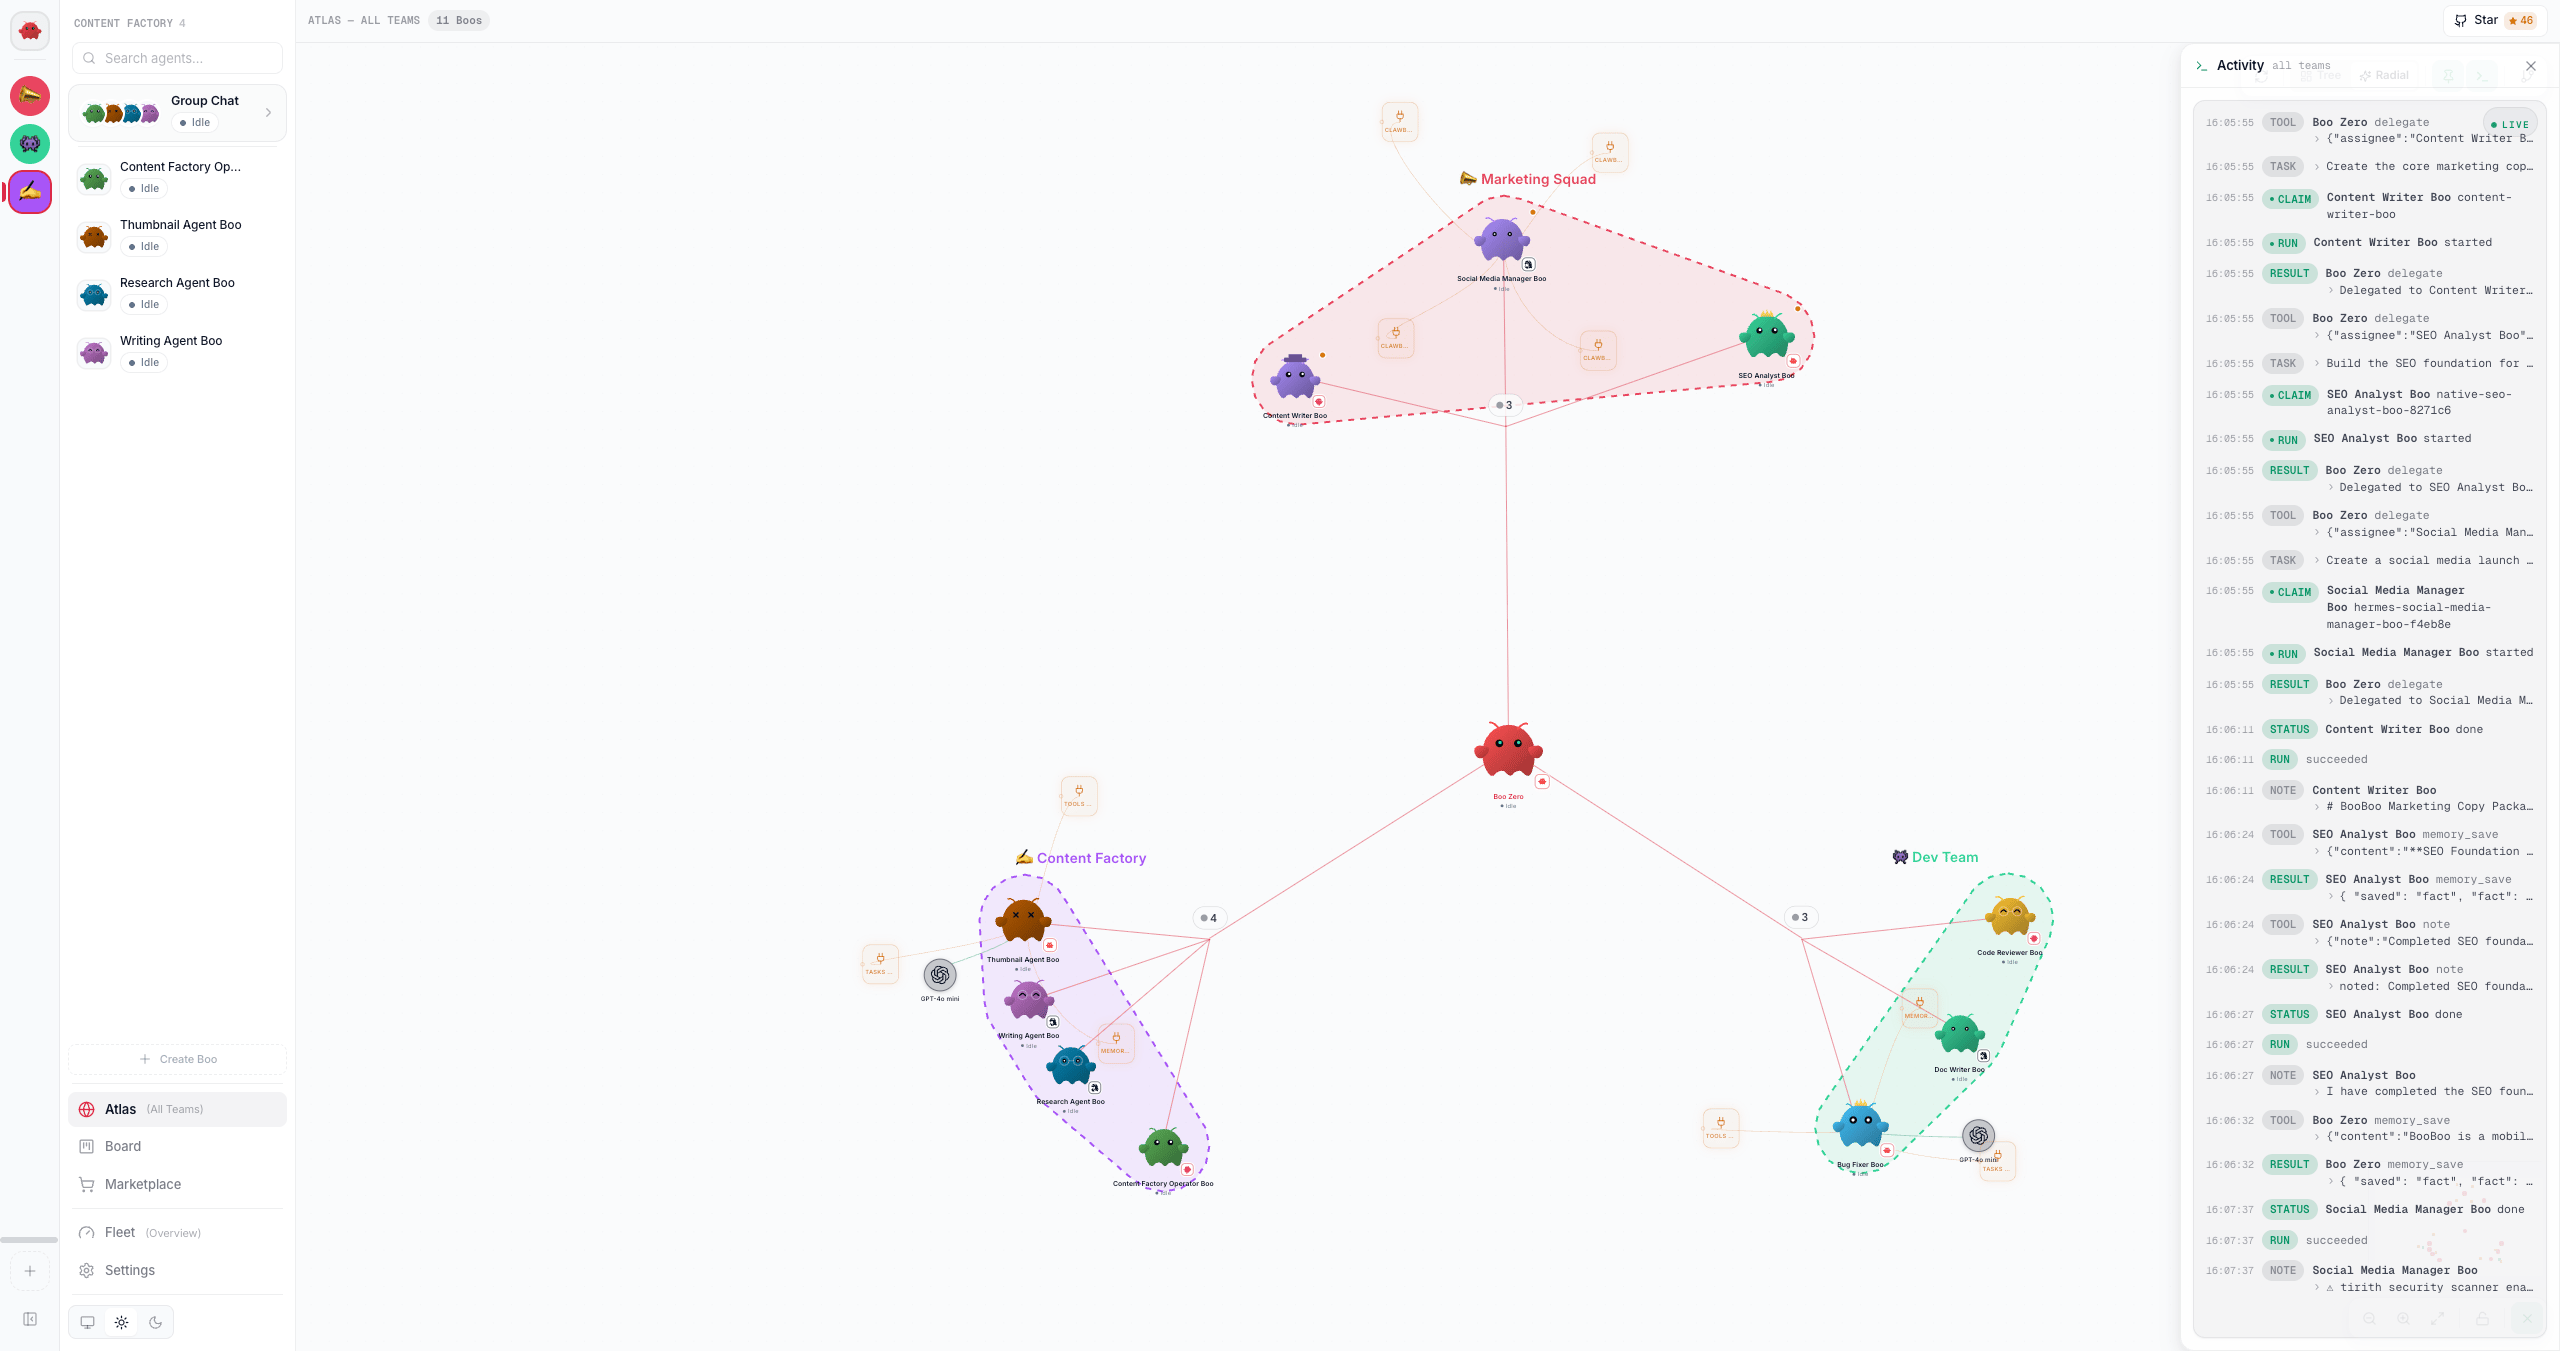 The same event log feeds a live **activity terminal**, `ActivityTerminal`, a console that backfills the recent window (`GET /api/obs/events`) then live-tails the SSE stream (`GET /api/obs/stream`). It renders tool calls, tool results, errors, cost, and lifecycle events for every runtime uniformly, with a `Live` / `Reconnecting` pulse, tabular timestamps, and expandable tool I/O. It is mounted at three scopes:
| Scope | Where | Filter |
| --------- | ------------------------------------------------------------------------------------------------------------------------------------------------------- | ---------------- |
| Per-task | The **Activity** section of the task drawer ([the board](/using/board)) | `taskId` |
| Per-agent | The **Activity** tab in [agent detail](/using/agents) | `agentId` |
| Global | The Atlas **Activity** dock, a right-edge slide-in toggled by the `Activity` button on the [Ghost Graph](/using/ghost-graph) toolbar (Atlas scope only) | none (all teams) |
Every runtime's activity reaches the event log **server-side**: the executor runner emits for the native and coding-agent runtimes, and the server-side team orchestrator emits `tool_call` / `tool_result` / `error` (and cost) for OpenClaw as it drives each turn. A `POST /api/obs/ingest` route remains as a defensive mirror for browser-observed runtime events, restricted to exactly those three kinds; board lifecycle events are always emitted server-side and are never accepted from the browser. This is what makes the terminal uniform across runtimes.
## Options and variations
The read endpoints share a query vocabulary:
| Query param | Routes | Effect |
| ----------------- | ------------------------------------- | ---------------------------------------------------------- |
| `teamId` | `events`, `health`, `graph`, `stream` | Scope to one team |
| `taskId` | `events`, `stream` | Scope to one task |
| `agentId` | `events`, `stream` | Scope to one agent |
| `traceId` | `events` | Scope to one trace |
| `kinds=a,b,c` | `events` | Comma-separated event kinds |
| `since=` | `events`, `errors`, `stream` | Wall-clock cutoff (ms epoch); on `stream`, a resume cursor |
| `afterSeq=` | `events` | Cursor on the monotonic `seq` |
| `limit=` | `events` | Row cap |
| `order=asc\|desc` | `events` | Causal (`asc`) or newest-first (`desc`) |
| `harnessBug=true` | `errors` | Only harness bugs (`Unknown` class) |
`health` and `graph` fold the most recent 5000 events for the requested scope, so both surfaces keep tracking current activity however long the log has been accumulating. An agent or task whose events have scrolled out of that window stops appearing.
The SSE stream (`GET /api/obs/stream`) is a short-interval DB-tail on the `seq` cursor. `EventSource` reconnects automatically and resumes from the last `seq` via its `Last-Event-ID` header (or `?since=`). Each event's `data` is redacted before it reaches the browser; credential-shaped keys and values are masked, while numeric cost and token fields survive.
## Verify it worked
* Open Observability with at least one completed board task. The header badge reads `N tasks · M agents` instead of `event log`.
* Click a trace; the right column shows the metrics bar (non-zero cost/tokens for a real run) and the indented timeline.
* The Fleet health section lists your agents with a status pill. A finished run reads `idle`.
* Click **Run smoke evals**; the scorecard fills with `pass@1` / `pass^k` and the per-task table within a second or two. (If it fails, the panel shows "Smoke run failed; check the server log.")
## Troubleshooting
**Everything is empty.** The panel only shows what is in the event log. A fresh install, or a server that has never executed a board task, has nothing to project. Run a team task first.
**An agent reads `zombie` but the work looks finished.** `zombie` means no event landed for over 30 minutes while an execution was still open; the process is almost certainly dead. If the work genuinely finished, the missing `execution_completed` event is the real problem; the next server boot's orphan reconciliation will release the task.
**A harness-bug count above zero is a signal, not a crash.** An `Unknown` error class means Clawboo's taxonomy did not recognize a failure. Open the trace, read the error message, and report it; it is a gap in Clawboo's error handling, by design surfaced rather than hidden.
## See also
* [Observability](/concepts/observability): the event log, projections, and builder≠judge model
* [`/api/obs` reference](/reference/rest-api/observability): full request/response and SSE event shapes, plus `/api/eval/smoke`
* [Events and errors reference](/reference/events-and-errors): every orchestration event kind and the error taxonomy
* [The board](/using/board): per-task activity and execution ledger
* [Ghost Graph](/using/ghost-graph): the live graph overlay sourced from the same projection
* [Agents](/using/agents): the per-agent Activity tab
The same event log feeds a live **activity terminal**, `ActivityTerminal`, a console that backfills the recent window (`GET /api/obs/events`) then live-tails the SSE stream (`GET /api/obs/stream`). It renders tool calls, tool results, errors, cost, and lifecycle events for every runtime uniformly, with a `Live` / `Reconnecting` pulse, tabular timestamps, and expandable tool I/O. It is mounted at three scopes:
| Scope | Where | Filter |
| --------- | ------------------------------------------------------------------------------------------------------------------------------------------------------- | ---------------- |
| Per-task | The **Activity** section of the task drawer ([the board](/using/board)) | `taskId` |
| Per-agent | The **Activity** tab in [agent detail](/using/agents) | `agentId` |
| Global | The Atlas **Activity** dock, a right-edge slide-in toggled by the `Activity` button on the [Ghost Graph](/using/ghost-graph) toolbar (Atlas scope only) | none (all teams) |
Every runtime's activity reaches the event log **server-side**: the executor runner emits for the native and coding-agent runtimes, and the server-side team orchestrator emits `tool_call` / `tool_result` / `error` (and cost) for OpenClaw as it drives each turn. A `POST /api/obs/ingest` route remains as a defensive mirror for browser-observed runtime events, restricted to exactly those three kinds; board lifecycle events are always emitted server-side and are never accepted from the browser. This is what makes the terminal uniform across runtimes.
## Options and variations
The read endpoints share a query vocabulary:
| Query param | Routes | Effect |
| ----------------- | ------------------------------------- | ---------------------------------------------------------- |
| `teamId` | `events`, `health`, `graph`, `stream` | Scope to one team |
| `taskId` | `events`, `stream` | Scope to one task |
| `agentId` | `events`, `stream` | Scope to one agent |
| `traceId` | `events` | Scope to one trace |
| `kinds=a,b,c` | `events` | Comma-separated event kinds |
| `since=` | `events`, `errors`, `stream` | Wall-clock cutoff (ms epoch); on `stream`, a resume cursor |
| `afterSeq=` | `events` | Cursor on the monotonic `seq` |
| `limit=` | `events` | Row cap |
| `order=asc\|desc` | `events` | Causal (`asc`) or newest-first (`desc`) |
| `harnessBug=true` | `errors` | Only harness bugs (`Unknown` class) |
`health` and `graph` fold the most recent 5000 events for the requested scope, so both surfaces keep tracking current activity however long the log has been accumulating. An agent or task whose events have scrolled out of that window stops appearing.
The SSE stream (`GET /api/obs/stream`) is a short-interval DB-tail on the `seq` cursor. `EventSource` reconnects automatically and resumes from the last `seq` via its `Last-Event-ID` header (or `?since=`). Each event's `data` is redacted before it reaches the browser; credential-shaped keys and values are masked, while numeric cost and token fields survive.
## Verify it worked
* Open Observability with at least one completed board task. The header badge reads `N tasks · M agents` instead of `event log`.
* Click a trace; the right column shows the metrics bar (non-zero cost/tokens for a real run) and the indented timeline.
* The Fleet health section lists your agents with a status pill. A finished run reads `idle`.
* Click **Run smoke evals**; the scorecard fills with `pass@1` / `pass^k` and the per-task table within a second or two. (If it fails, the panel shows "Smoke run failed; check the server log.")
## Troubleshooting
**Everything is empty.** The panel only shows what is in the event log. A fresh install, or a server that has never executed a board task, has nothing to project. Run a team task first.
**An agent reads `zombie` but the work looks finished.** `zombie` means no event landed for over 30 minutes while an execution was still open; the process is almost certainly dead. If the work genuinely finished, the missing `execution_completed` event is the real problem; the next server boot's orphan reconciliation will release the task.
**A harness-bug count above zero is a signal, not a crash.** An `Unknown` error class means Clawboo's taxonomy did not recognize a failure. Open the trace, read the error message, and report it; it is a gap in Clawboo's error handling, by design surfaced rather than hidden.
## See also
* [Observability](/concepts/observability): the event log, projections, and builder≠judge model
* [`/api/obs` reference](/reference/rest-api/observability): full request/response and SSE event shapes, plus `/api/eval/smoke`
* [Events and errors reference](/reference/events-and-errors): every orchestration event kind and the error taxonomy
* [The board](/using/board): per-task activity and execution ledger
* [Ghost Graph](/using/ghost-graph): the live graph overlay sourced from the same projection
* [Agents](/using/agents): the per-agent Activity tab