> ## Documentation Index
> Fetch the complete documentation index at: https://docs.claw.boo/llms.txt
> Use this file to discover all available pages before exploring further.
# Using Clawboo: the feature map
> A navigation index to every Clawboo dashboard feature, grouped by where it lives in the UI.
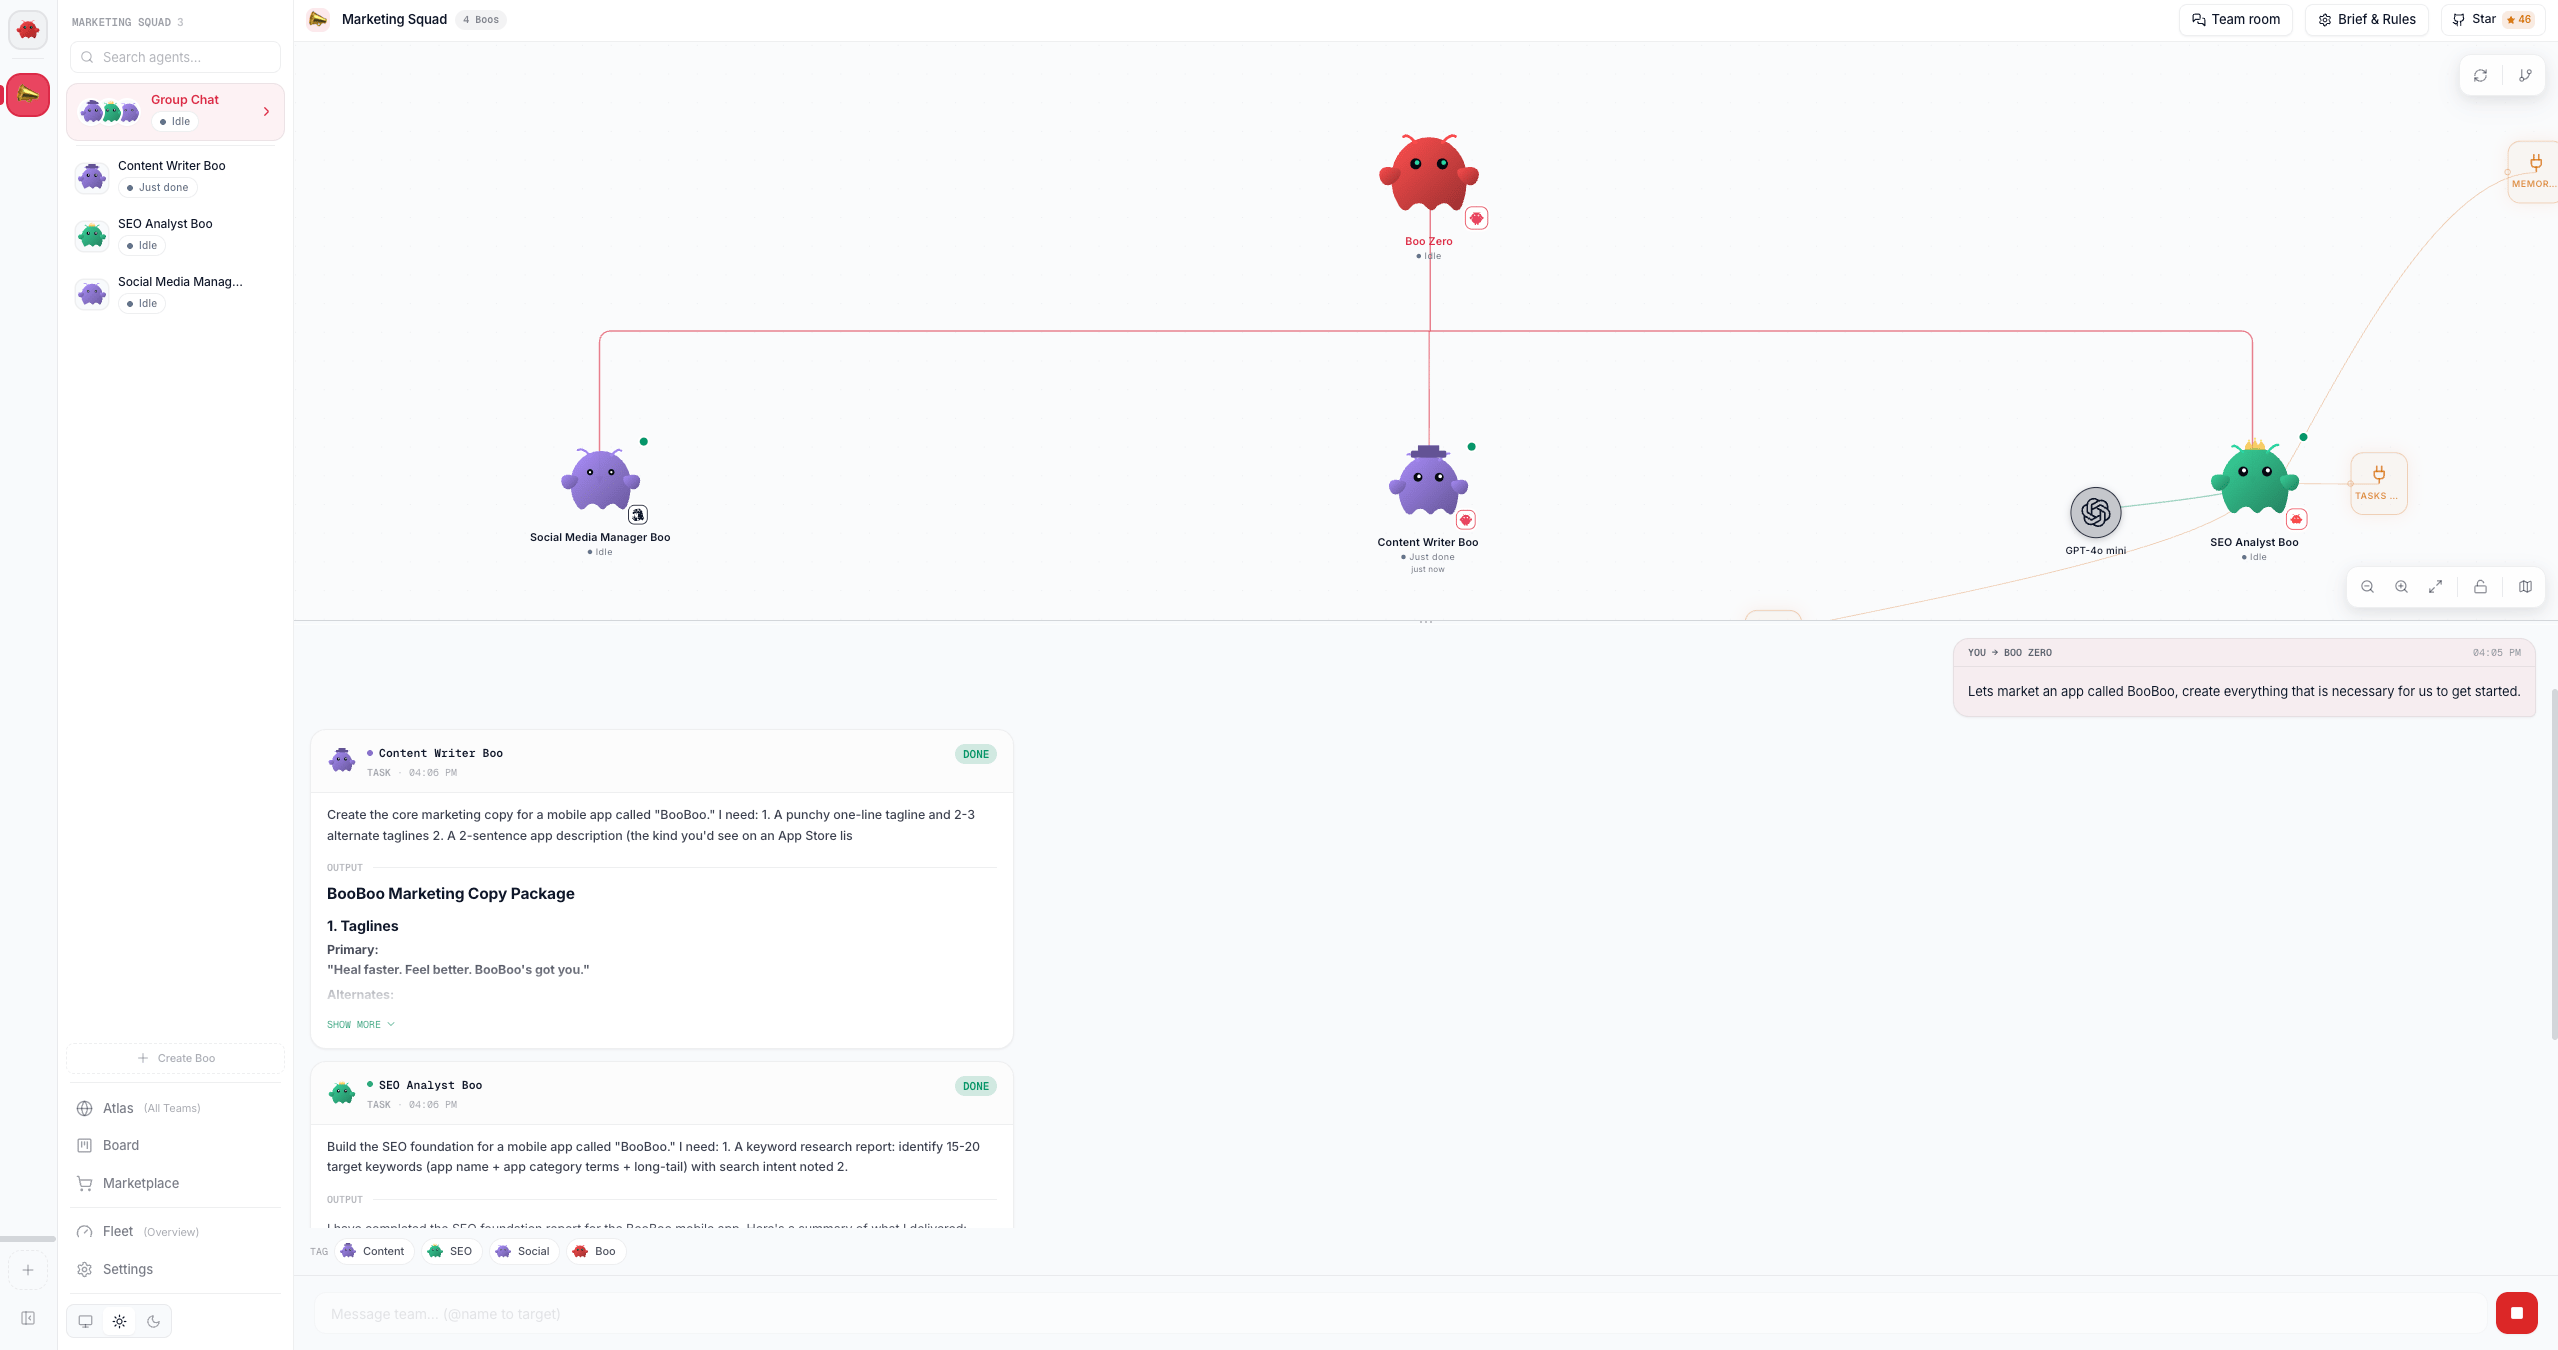
Clawboo's dashboard is a single window split into three columns: a leftmost team-icon strip, an agent/nav column, and the main content area. The main area is a [discriminated `ViewMode`](/appendices/glossary): selecting a team opens its **group chat**, clicking an agent opens its **detail view**, and the bottom nav buttons switch the main area to one of fourteen full-screen **nav panels** (`NAV_VIEWS` in `stores/view.ts`, each mapped to a lazily-loaded feature component by `NavPanel` in `features/layout/navPanels.tsx`, which also wraps each panel in its own error boundary). A few surfaces, Teams, Group chat, Agents, Boo Zero, and Theming, are reached through the sidebar, agent rows, the group-chat row, or the theme toggle rather than a nav button. This page is mostly navigation; each linked how-to grounds itself in its own feature module and backing API route(s).
## Team-scoped surfaces
These live in the left two columns and follow the currently selected team. The team-icon strip (`TeamSidebar`) and the agent/group-chat column (`AgentListColumn`) drive them.
* **[Teams](/using/teams)**: Create and manage teams, set the team leader, capture per-team rules, and pick a color collection. Reached from the team-icon strip's **+ Create team** button and right-click context menu.
* **[Group chat](/using/group-chat)**: The team's collaboration room, opened by clicking a team icon or the **Group Chat** row in the agent column. Gated once per team by the "Know Your Team" onboarding flow before the composer unlocks.
* **[Ghost Graph & Atlas](/using/ghost-graph)**: The team's agent topology (embedded in group chat) and the global all-teams **Atlas** view (the `graph` nav slot, labeled **Atlas (All Teams)**). Halos, peacock expand/collapse, and connect mode live here.
* **[Agents](/using/agents)**: Click any agent row to open its detail view: chat, the SOUL / IDENTITY / TOOLS / AGENTS file editors, and the personality sliders.
* **[Boo Zero](/using/boo-zero)**: The universal team leader. Its standalone view (opened from the mascot icon) hosts the display name and global brief; per-team briefs and rules live behind the gear in the group-chat header.
## Org-wide nav panels
These are the bottom nav buttons in `AgentListColumn`. Each switches the main content area to a full-screen panel; all are always available (no feature gates).
* **[Board](/using/board)**: The durable kanban board, fused with chat. Columns by task status; cards carry runtime, verification, and cost badges.
* **[Marketplace](/using/marketplace)**: Browse and deploy the 304 first-class agents and 82 workflow teams across a Skills / Agents / Teams tab strip.
* **[Cost & budgets](/using/cost-and-budgets)**: The **Tokens Used** dashboard: per-agent and per-team token usage and trends, plus USD budgets via the Governance surface.
* **[Scheduler](/using/scheduler)**: The Routines tab for recurring team-task and runtime-own-life schedules.
* **[Memory](/using/memory-browser)**: Search, save, and browse the shared Memory-MCP tier (facts and procedures).
* **[Capabilities](/using/capabilities-dashboard)**: The unified capability inventory across all runtimes, grouped by runtime and kind, with manageability-derived actions.
* **[Observability](/using/observability-dashboard)**: Traces, the error taxonomy, fleet health, the delegation-graph projection, and the eval scorecard.
* **[Governance](/using/governance-dashboard)**: Budgets, caps, the audit log, and the shared tool-approval queue.
* **[System](/using/system-maintenance)**: Gateway control, default model, API keys, agent coordination, and system info.
* **[System health](/using/system-health)**: The boot-probe checklist and resolved runtime state, the one liveness surface that answers with the Gateway down.
## App-wide
* **[Approvals](/using/approvals)**: The pending-approval queue (Gateway exec approvals plus the brokered tool-approval queue). Not a nav panel: it renders as the Board's **Needs approval** column and as an inline tray above the group-chat composer.
* **[Theming](/using/theming)**: The light/dark/system theme toggle in the bottom-left of the sidebar (`ThemeToggle`); fresh installs default to light.
## Where things live (nav slots)
The fourteen nav panels map one-to-one to `NavView` ids. The table is the same wiring `ContentArea` uses, so it doubles as a reference for the `navigateTo(view)` action. Only the four sidebar work surfaces have a number shortcut: `Cmd/Ctrl+1–4` is Atlas, Fleet, Marketplace, Board. The other ten live in the Settings modal (`Cmd/Ctrl+,`).
| Nav id (`NavView`) | Sidebar label | Page |
| ------------------ | ----------------- | --------------------------------------------------------- |
| `graph` | Atlas (All Teams) | [Ghost Graph & Atlas](/using/ghost-graph) |
| `fleet` | Fleet (Overview) | [Dashboard tour](/getting-started/dashboard-tour) |
| `marketplace` | Marketplace | [Marketplace](/using/marketplace) |
| `board` | Board | [Board](/using/board) |
| `runtimes` | Runtimes | [Connecting runtimes](/runtimes/connecting-runtimes) |
| `memory` | Memory | [Memory browser](/using/memory-browser) |
| `governance` | Governance | [Governance dashboard](/using/governance-dashboard) |
| `capabilities` | Capabilities | [Capabilities dashboard](/using/capabilities-dashboard) |
| `providers` | Providers | [Connecting runtimes](/runtimes/connecting-runtimes) |
| `scheduler` | Scheduler | [Scheduler](/using/scheduler) |
| `cost` | Tokens Used | [Cost & budgets](/using/cost-and-budgets) |
| `system` | System | [System & maintenance](/using/system-maintenance) |
| `obs` | Observability | [Observability dashboard](/using/observability-dashboard) |
| `health` | System Health | [System health](/using/system-health) |
The `fleet` panel (a read-only overview) does not have its own how-to; it is covered in the [dashboard tour](/getting-started/dashboard-tour).
**Approvals is not a nav slot.** It has a how-to page ([Approvals](/using/approvals)) but no `NavView` id: approvals render on the [board](/using/board)'s **Needs approval** column and in an inline tray above the [group-chat](/using/group-chat) composer.
 ## See also
* [Dashboard tour](/getting-started/dashboard-tour): Atlas, the sidebar, and the view modes, end to end
* [First team](/getting-started/first-team): deploy a team and watch it collaborate
* [Concepts](/concepts/index): the models behind these features (the board, peer chat, verification, governance)
* [Runtimes overview](/runtimes/index): the five runtime classes and the capability matrix
* [REST API reference](/reference/rest-api/index): every backing route
## See also
* [Dashboard tour](/getting-started/dashboard-tour): Atlas, the sidebar, and the view modes, end to end
* [First team](/getting-started/first-team): deploy a team and watch it collaborate
* [Concepts](/concepts/index): the models behind these features (the board, peer chat, verification, governance)
* [Runtimes overview](/runtimes/index): the five runtime classes and the capability matrix
* [REST API reference](/reference/rest-api/index): every backing route